
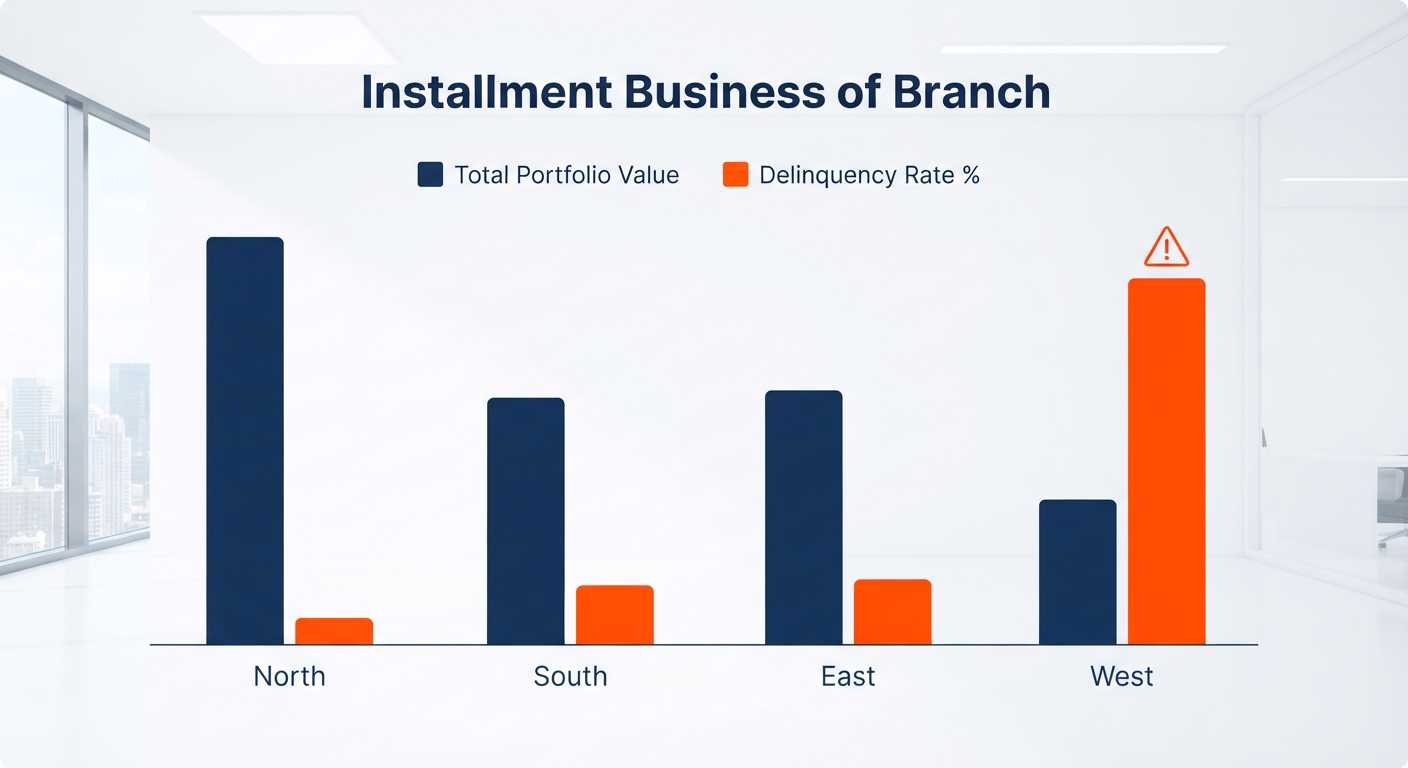
How to Compare Branch Performance in an Installment Business
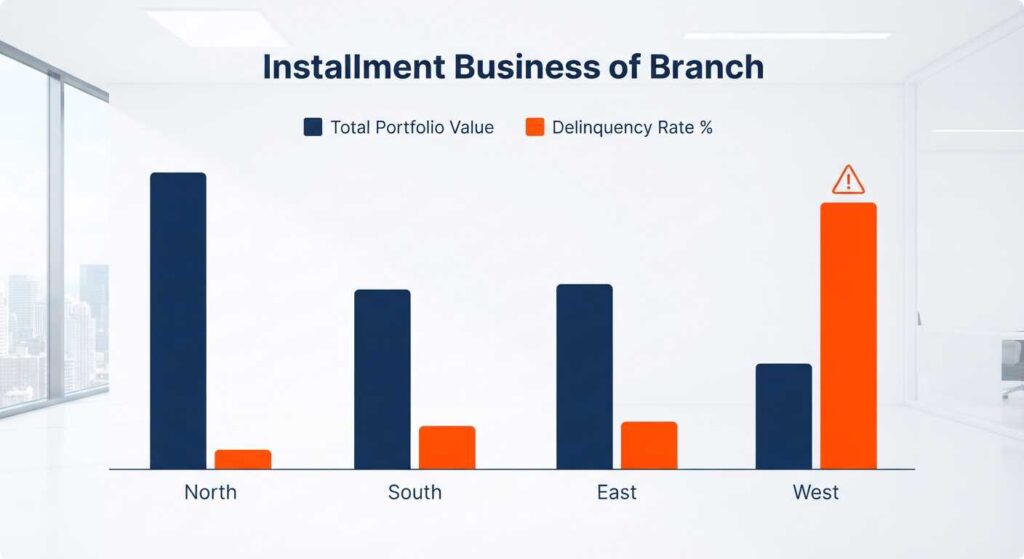
How to Compare Branch Performance in an Installment Business
Two branches with the same total revenue can be performing very differently underneath. Comparing branch performance properly means looking past the headline number to what actually drives it.
Once an installment business has more than one branch, a natural question follows almost immediately: which one is doing better? The honest answer usually requires more than glancing at which branch brought in more money last month. Revenue alone reflects branch size and product mix as much as it reflects how well that branch is actually being run.
The metrics that actually reveal branch performance
Three numbers, compared side by side across branches, tend to reveal far more than total revenue on its own: collection efficiency (the share of expected payments that actually came in), overdue balance as a percentage of that branch’s total portfolio, and new customer growth. Together, these show whether a branch is not just selling, but selling to the right customers and collecting reliably from them.
| Metric | Branch A | Branch B | Branch C |
|---|---|---|---|
| Collection efficiency | 94% | 78% | 91% |
| Overdue % of portfolio | 6% | 19% | 9% |
| New customers (month) | 22 | 31 | 18 |
Read this way, Branch B’s higher new-customer count doesn’t tell the full story — its collection efficiency and overdue percentage suggest a branch growing quickly but not managing that growth well. Branch A, smaller on new customers, is running a noticeably tighter operation. Neither of these facts would show up in a simple revenue comparison.
Why revenue alone misleads
A branch located in a busier commercial area, or selling higher-value products like furniture rather than mobile accessories, will naturally show higher revenue than a smaller branch in a quieter area — regardless of how well either is actually managed. Comparing raw revenue across branches with different customer bases and product mixes is close to meaningless. Comparing collection efficiency and overdue rates, which are ratios rather than absolute numbers, gives a fairer picture of operational quality independent of branch size.
Weekly comparison beats monthly
Reviewing branch performance monthly gives head office twelve chances a year to catch a struggling branch. Reviewing weekly gives roughly fifty. That difference matters enormously in practice — a branch whose collection efficiency starts slipping in week one of a bad stretch can be addressed within days if someone’s actually looking weekly, rather than discovered a month later after the problem has had time to compound across dozens of additional accounts.
What a comparison should lead to, not just reveal
Branch comparison data is only useful if it changes something. A branch consistently underperforming on collection efficiency might need additional recovery staff, a review of how credit is being extended locally, or simply closer coaching for a newer branch manager still finding their footing. The comparison itself doesn’t fix anything — it points to where attention is actually needed, which is different from where attention happens to be going by default or habit.
Avoiding the trap of comparing dissimilar branches unfairly
Not every branch should be held to identical absolute targets. A branch that’s been open six months is not in a fair comparison against one that’s been running for three years with an established customer base. The metrics that matter — collection efficiency, overdue percentage — travel reasonably well across branches of different ages and sizes, but the targets set for each should account for where that specific branch actually is in its own growth curve, not an identical number applied uniformly regardless of context.
A useful adjustment many multi-branch businesses make is comparing each branch primarily against its own trend over time, alongside the cross-branch comparison — is this specific branch’s collection efficiency improving or declining month over month, regardless of how it stacks up against the others. A newer branch trending upward toward the established branches’ numbers is a genuinely different situation than an established branch trending downward, even if their current absolute numbers happen to look similar on a given week.
Building the habit of looking, not just having the data
Plenty of multi-branch businesses technically have the data needed to compare branches properly — it exists somewhere in reports nobody’s reviewing on a regular schedule. The value only shows up once comparison becomes an actual habit: a specific day each week where head office looks at the numbers side by side, asks why any branch stands out, and follows up on what it finds. Data that exists but isn’t regularly reviewed protects nothing.
Turning a comparison into a conversation, not a scoreboard
There’s a risk in branch comparison that’s worth naming directly: treated purely as a ranking, it can turn into a demoralizing scoreboard rather than a useful diagnostic tool. A branch manager who only ever hears “you’re behind Branch A again” without any discussion of why, or what support might help close the gap, tends to disengage rather than improve. The more productive version of this comparison pairs the numbers with an actual conversation — understanding whether a lagging branch is dealing with a newer customer base, a staffing gap, or a genuinely different local market, and adjusting the response accordingly rather than assuming underperformance always means the same underlying problem.
Compare every branch, side by side, automatically
QistBook shows collection efficiency, overdue rates, and growth across every branch in one dashboard, updated in real time.
Schedule a DemoFrequently Asked Questions
What metrics matter most when comparing branch performance in an installment business?
Collection efficiency (percentage of expected payments actually collected), overdue balance as a share of total portfolio, and new customer growth are the three that give the clearest picture, though total revenue alone often misleads.
Why is total revenue a misleading way to compare branches?
A branch with higher revenue simply because it has more customers or higher-value products isn’t necessarily performing better than a smaller branch with a much higher collection efficiency rate. Revenue reflects size, not operational quality.
How often should branch performance be compared?
Weekly comparison catches problems faster than monthly review, giving head office roughly four times as many chances to notice and correct a struggling branch before a full month has passed.
Related reading

Umaira
I explore the people and processes behind successful installment businesses, including customer relationships, sales practices, staff workflows, and everyday challenges faced by retailers. Through my writing, I aim to present useful ideas and real-world approaches that make complex business practices easier to understand and apply in a busy retail environment.
View all posts →